What is Regression Analysis?
Regression analysis is a statistical process for modeling the relationship between a dependent variable Y and one or more independent variables X. This modeling is done by finding the regression, or prediction, line that best fits the data, and then using it in order to identify the mathematical relationship that exists between the dependent and independent variables, to quantify the effect that changes in the independent variable have on the dependent variable, and to utilize these ideas in order to predict values of the dependent variable given the values of the independent variables for a specific observation. The most rudimentary regression model is the simple (linear) regression model, which consists of one dependent variable and one independent variable. The next most simple model is the multiple regression model, which consists of one dependent variable and two or more independent variables and is what will be utilized in this project. It is worth noting that these regression models can become increasingly more complex as different features become included (i.e. quadratic/logarithmic/exponential models, log transformations of the variables), but for the sake of simplicity and avoiding confusion, they will not be explained on this site.
Steps in Applied Regression analysis
- First, choose the dependent variable (determined by purpose of research)
- After choosing the dependent variable, follow this sequence:
- Review the literature and develop the theoretical model
- Specify the model: Select the independent variables and the functional form
- Hypothesize the expected signs of the coefficients
- Collect, inspect, and clean the data
- Estimate and evaluate the equation
- Document results
General form of a regression Equation
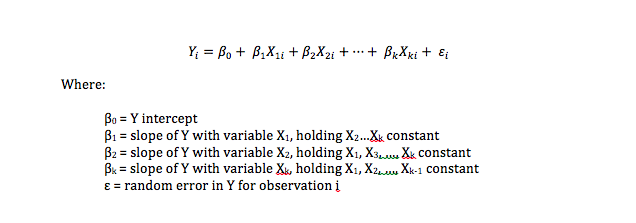
Interpretation
The interpretation for B0, or the Y-intercept, is the value of the dependent variable (Y) if the value of all independent variables is equal to zero (Xi...Xk = 0). This value provides a starting point on which we can begin to build our predictions, and it may or may not provide a useful interpretation based on whether it crosses the threshold of reality.
The interpretation for Bi, or the slope of the line given one variable while holding all others constant, is the Bi unit increase in the dependent variable (Y) for a one unit increase in the independent variable (X).
The interpretation for Bi, or the slope of the line given one variable while holding all others constant, is the Bi unit increase in the dependent variable (Y) for a one unit increase in the independent variable (X).
