Variables
- Urban: Whether or not an individual attended high school in an urban area. Coded as 0 for No and 1 for Yes. It is hypothesized that attending an urban high school will have a negative relationship with GPA.
- Pre-K: Whether or not an individual attended Pre-Kindergarten. Coded as 0 for No and 1 for Yes. It is hypothesized that attending Pre-K will have a positive relationship with GPA.
- HS Type: Describes the type of high school an individual attended. Coded as 0 for Public and 1 for Private or Catholic. It is hypothesized that attending a private or catholic high school will have a positive relationship with GPA.
- HS SEC: Describes the socioeconomic composition of the high school an individual attended. Coded as 0 for Predominantly Lower or Middle Class and 1 for Predominantly Upper Class. It is hypothesized that attending a predominantly upper class school will have a positive relationship with GPA.
- HS Race: Describes the racial composition of the high school an individual attended. Coded as 0 for Predominantly White and 1 for Predominantly Minority. It is hypothesized that attending a predominantly minority school will have a negative relationship with GPA.
- Teach Qual: Describes the average quality of the teachers at the high school an individual attended. Rated from 1 to 10 with 1 being the worst and 10 being the best. It is hypothesized that teacher quality will have a positive relationship with GPA.
- Class Size: Describes the average size of a class at the high school an individual attended. It is hypothesized that class size will have a negative relationship with GPA.
- Involved: Describes whether an individual's parents were involved in their educational experience. Coded as 0 for No and 1 for Yes. It is hypothesized that parental involvement will have a positive relationship with GPA.
- Race: Describes an individual's racial background. Coded as 0 for White and 1 for Non-white. It is hypothesized that being a minority will have a negative relationship with GPA.
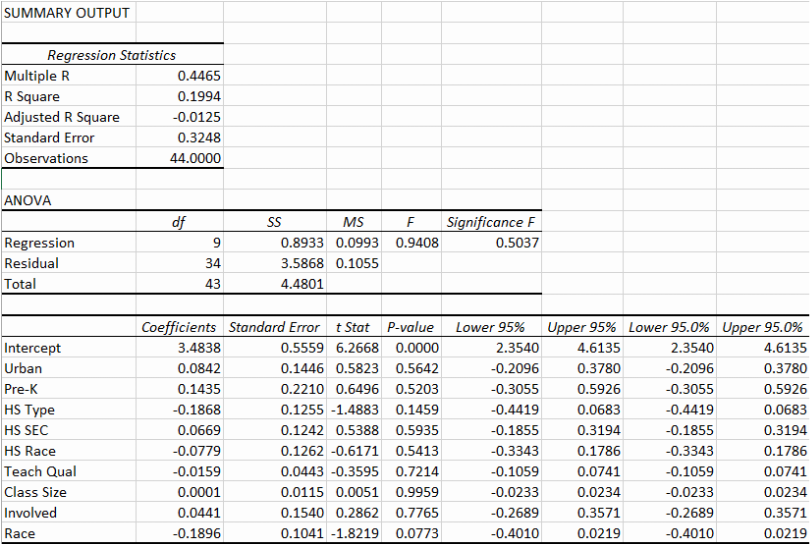
Regression Output
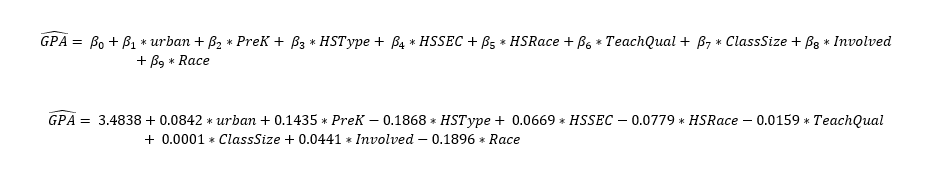
Regression Equations
Analysis
In examining the results from this regression, there are a number of very troubling issues. First, we can see that the value of R Squared is 0.1994, which means that 19.94% of the variation in the dependent variable GPA is explained by all 9 of the independent variables. This is not a good percentage to begin with, but after looking at the value of Adjusted R Squared, which penalizes for additional independent variables and for this model is equal to -0.0125, we can see that our independent variables do not explain absolutely any of the variation in the dependent variable. Continuing to examine the results, we can see that Significance F is 0.5037, which is much greater than the 0.05 cutoff that we use to determine significance. This shows us that the overall regression is not statistically significant, and there is a 50.37% chance that the results that we got were completely due to chance. Furthermore, upon examining the P-values for each of the individual independent variables, we see that each of them are greater than the 0.05 cutoff that we use to determine significance, which shows that none of the independent variables utilized are statistically significant, and further supports that our overall regression is not statistically significant. Based on all of this evidence, it is easy to determine that this model does not do a good job of making a statistically significant prediction for Y.
